Aug 10 2023
Memory Management in Java


Rashesh Ved
Product ManagerIntroduction
Memory Management in Java refers to allocation and deallocation of memory to java objects that resides in areas called Stack and Heap. Java has an automatic memory deallocation system known as Garbage Collector.This article presents you with some concepts of Java Memory management, working of Garbage Collector in JVM.
What is Memory Management In Java?
Memory management in Java is the process of allocating working memory space to new objects and properly removing unreferenced objects to create space for those new object allocations. Generally, developers don’t have to deal with memory handling in java directly because the Garbage Collector has the duty of memory deallocation handling and it runs automatically. But many a times due to improper resource handling from code the memory consumed by the java applications is way high than what Garbage Collections cleans up and as a result their occurs memory leakage and than their occurs need for portal performance tunning for proper memory management.
Why Programmers must have knowledge of memory management in java?
As we already know java itself manages the memory and no special intervention of programmers is needed as Garbage Collector has the role of clearing the objects that are no longer used by the application from the working memory. Then why do programmers need to learn about automatic memory management in java? Though it is said to be automatic, Garbage Collector doesn’t guarantee the deallocation of memory/objects that are still referenced. Programmers unknowingly leave objects referenced, even after their use is complete, which leads to memory leaks or other consequences that cannot be managed by Java Virtual Machine (JVM). Programmers should have an understanding of Java memory management to write efficient programs without memory leaks. Hence as a programmer, you should know which objects are eligible for automatic garbage collection and which are not to write efficient and high-performance based programs with very little chance of crashing.
Types of Java Memory Management
Their are basically two major concepts for Java Memory Management
- JVM Memory structure
- Working of Garbage Collector.
1) JVM Memory Structure
The Java memory model describes how threads in the Java programming language interact through memory. JVM memory structure has different areas where the objects of the programs reside.
JVM Memory Is Divided into multiple parts:
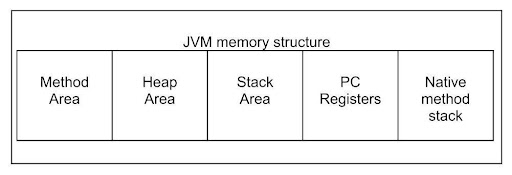
Method Area
Method area is a logical part of the heap area that is created at the time of Virtual Machine startup. The method area is allocated for method data, class structures, constructor field data as well as for interfaces and special methods in a class. Depending on system configuration, the Method area can be fixed or dynamic required by the computation. It need not be contagious. Garbage collection is mandatory in heap, but the Method area may or may not be garbage collected though it is a logical part of the heap area.
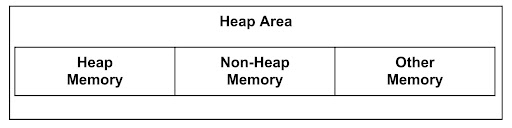
Heap Area
Heap area is a shared runtime data area that can be allocated to real objects of all class instances and arrays. Depending on the configuration of the system, the size of the heap can be dynamic or fixed. It is initiated during the Java Virtual Machine Startup. Heap Memory allocated to the objects is reclaimed by the Garbage Collector. By default, the maximum size of the heap is 64 Mb. When you use new keyword, an object is allocated memory in the heap and its memory is referenced using a variable from the thread’s stack.
There is always only one Heap for a running Java Virtual Machine process. When the heap is filled the garbage collector clears the objects.
VM options to configure heap size :
To set the maximum Java heap size: -Xmx
To set the initial Java heap size: -Xms
Non-Heap memory: JVM’s non-heap Memory stores per-class structures like runtime constant pool, code for methods, field and method data, interned strings, and codes for constructors. It is also created at the time of Virtual Machine. Similar to the heap, the maximum default Non-Heap memory is also 64 Mb.
VM option to configure the maximum size –XX:MaxPermSize
Other Memory: It is used to store the JVM code, JVM internal structure, data, and loaded profiler agent code, etc.
JVM Stack area
A Stack is created simultaneously with the creation of a thread. Stack is used to store method-specific values that are short-lived and are referenced to other objects in heap. The stack memory need not be contagious. Its size can either be fixed or dynamic and can be chosen independently when it is created.
What is Stack Frame?
Stack frame is the data structure of thread’s data. The thread data represents the state of thread in the current method.
- Stack frame stores partial results,data also performs dynamic linking.
- Each frame contains its own Local Variable Array (LVA), Frame Data (FD), and Operand Stack (OS).
- The sizes of LVA, FD and OS are determined at the compile time
- In a thread of control, only one frame is active at a time i.e current frame. This frame is called current frame and the class of method is called current class.
- In case the method invokes another method or the method is completed, the frame stops the current method.
- Frame can only be referenced by the thread that created it.
Program Counter (PC) Registers
Every JVM thread that is created has an associated PC register. The value of the program counter is undefined in the native method while the non-native method has a Program Counter that stores the address of the JVM instructions currently being executed. It also stores the native pointer or a return address.
Native Method Stack
Native Method stack is also known as C stack. Native method stacks are written in other programming languages, not java. The Java Native Interface (JNI) calls the native stack. This type of memory is allocated to the thread when it is created. Similar to other types it can be fixed or dynamic. Native stack performance depends on the Operating System.
2) Working of a Garbage Collector
When a program runs in java, objects are allocated memory in the heap. Garbage Collector tries to keep as much free working memory space as possible. Heap is the only part of the java memory where Garbage Collection is possible.
What is Java Garbage Collection?
Garbage Collection is the process of collecting memory occupied by unreferenced objects. Garbage Collector is controlled by Java Virtual Machine (JVM), JVM chooses when to run the garbage collector. Garbage Collection is done whenever JVM detects the low availability of working memory resources. JVM also considers our request to perform garbage collection. But it’s not always guaranteed that JVM will comply with our request.
Criteria for an object to be eligible for garbage collection?
Every unreferenced object in the Heap is eligible for garbage collection. But what makes garbage collector think that an object is unreferenced or not referenced? As Java runs multiple threads, all usable objects in the Heap are reachable from stack frames of these running threads. Any object that is not reachable by any thread is considered unreferenced and becomes eligible for garbage collection.
Criteria for an object to be eligible for garbage collection?
- Java Virtual Machine controls the garbage collection process. It triggers the GC to reduce the burden of programmers by deallocation of memory occupied by unreferenced objects.
- Garbage Collection pauses other processes. This problem can be overcomed by applying several garbage-collector-based algorithms to improve the performance of the program. This process is termed as Garbage Collector tuning.
- Generational Garbage Collection can be another solution. Objects are grouped based on how many clock cycles they have survived (age). This process is termed as Garbage Collection distribution.
Garbage Collector Types
JVM chooses from the 3 types of Garbage Collectors based on the underlying hardware and does the deallocation. Programmers can also choose which garbage collector should be used.
The 3 types of garbage collectors are
- Serial GC : It is a single-threaded collector, mostly used in small applications which use small amounts of data. Specify the given command line to enable serial GC: -XX:+UseSerialGC
- Parallel GC : Also known as throughput collector. It uses multiple threads for the garbage collection process. You can enable parallel GC simply by specifying the given command line: -XX:+UseParallelGC
- Mostly Concurrent GC : This type of Garbage Collector runs Concurrent to the application. However, it’s not 100% Concurrent but the pause time of the threads is kept as low as possible to optimize the GC Performance.
Two types of Mostly Concurrent GC are
- Garbage First : It is a high throughput collector with a reasonable pause time. Enabling command line: -XX:+UseG1GC
- Concurrent Mark Sweep : CMS GC allows lower worst-case pause times than Serial or Parallel GC and where it is acceptable to sacrifice some application throughput to eliminate or greatly reduce the number of lengthy GC pauses. Enable command line: -XX:+UseConcMarkSweepGC
The Mark and Sweep Model
Mark and Sweep garbage collection model is used to clear the objects of the whole heap. Mark and Sweep model consists of 2 phases, the mark phase, and the sweep phase.
In the mark phase all the objects that are reachable from root sources, Java threads are marked as alive. All the objects which are still in use are identified and the rest of the objects are considered garbage.
In the Sweep phase, the heap is traversed to find the memory gaps between the objects in use and are recorded in the free list. These gaps are then made available for new object allocations.
The JRockit JVM uses two improved versions of the Mark and Sweep model, they are mostly concurrent Mark and Sweep model and Parallel Mark and Sweep.
Parallel Mark and Sweep
Parallel Mark and Sweep is also known as parallel garbage collection. This model uses all the available CPUs to perform the garbage collection as quickly as possible. In this model, all the Java threads are paused during the entire period of garbage collection.
Mostly Concurrent Mark and Sweep
Mostly Concurrent Mark and Sweep is also known as concurrent garbage collection. This model allows the java thread to continue running even during the long garbage collection tasks. However, the thread has to stop a few times for synchronization.
Mostly Concurrent Mark phase:
- Initial Marking : The root set of live objects is identified while the Java threads are paused.
- Concurrent marking : The references from the rootset are followed to find and mark the other live objects. It’s done while the Java threads are running.
- Precleaning : Any changes that occurred during the previous step are identified and any additional live objects are found and marked. It’s done while the Java threads are running.
- Final marking : similar to precleaning, changes during precleaning are identified and any additional live objects are found and marked while the Java threads are paused.
Mostly Concurrent Sweep phase:
- Sweeping one half of the heap : Java threads are allowed to allocate objects in the half of the heap that isn’t currently being swept. This is done while the Java threads are running A short pause is taken to switch halves
- Sweeping the other half of the heap : Java threads are allowed to allocate the objects in the half of the heap that was swept first. This is done while the Java threads are running. Again a short pause is taken for synchronizing and recording the statistics.
Conclusion
Managing the heap ensures the smooth running of your application and eliminates the chances of out-of-memory errors and system crashes. A clear understanding of how the memory is managed helps you in writing optimized codes that are memory efficient.